When two proteins share the same structure but not the same biology.
When an inhibitor works on one but not the other.
When structure offers no explanation, the missing variable is often
conformational entropy. LSP-MD makes it visible.
The gap in current approaches
Even if the backbone is stable, sidechains keep moving.
The most a PDB structure can give is B-factors, a per-atom estimate of mobility. The fuller picture is much more complex: sidechain dynamics defines conformational entropy, the thermodynamic variable underlying binding selectivity, allosteric signaling, and the cryptic functional differences between structurally similar proteins. The phenomenon is well established. Measuring it is the hard part.
Same fold, different selectivity
Two kinases. Same active site geometry. An inhibitor works on one and not the other. Structural alignment offers no explanation. For allosteric and isoform-selective targets, this is the rule rather than the exception.
The mutation that shouldn't matter
A single point mutation changes activity, regulation, or disease association. The crystal structure looks identical to wild-type. Standard structural analysis has no traction. The variant is doing its work somewhere structure isn't looking.
MD that doesn't converge to an answer
The simulation runs cleanly. Multiple replicates, trajectories that look reasonable, an RMSD that plateaus, an active site that stays put. Still no way to distinguish the states that matter. The information is in the data; the analysis isn't extracting it.
How LSP-MD is different
Sidechain dynamics and coupling, evaluated directly.
Conformational entropy depends on the mobility of individual sidechains, and on the correlations between sidechain motions across the protein. Many methods evaluate sidechain dynamics directly. Others build graphs from correlations between Cα atoms. LSP-MD addresses both: a graph-based method built around sidechain dynamics.
The thermodynamic variable controlling binding, selectivity and allostery: invisible to structure, but visible in sidechain thermal vibrations.
The structural biology paradigm ("Sequence determines Structure, Structure determines Function") served the field well for half a century. It is now understood to be incomplete. Dynamics is the missing link. The extended framework, "Sequence → Structure → Dynamics → Function", has become the working model for anyone dealing with allostery, binding selectivity, or cryptic functional differences between structurally similar proteins.
The functionally relevant dynamics often leaves no structural trace. The signal is not in the backbone. It is in how sidechain thermal motion organizes across the protein, and how that organization shifts when something changes.
This is conformational entropy (CE), the thermodynamic variable underlying protein function and regulation. It lives in the rotameric fluctuations of sidechains, in picosecond-to-nanosecond motions invisible to conventional structural models. NMR and room temperature crystallographic studies have provided direct experimental evidence that CE contributes substantially to binding affinity, substrate selectivity, and allosteric signaling. The phenomenon is well established.
The problem is measuring. Calculating CE rigorously for a protein is computationally intractable. The number of accessible microstates for even a small protein is astronomically large. Every existing method is an approximation. The question is which approximation best captures the signal that matters.
Conformational entropy is a property of the collective state space: how many ways a system can arrange itself. Estimating it from the mobility of individual residues is a reasonable approximation. It is also a fundamental weakness.
Entropy is a measure of complexity, the number of distinct states a system can have. The more states accessible, the higher the entropy. However, the variability of a system is not the sum of the variabilities of its parts. Correlations between elements reduce the accessible state space. For example, if a system has 10 elements and each can be in 3 different states, there are 3¹⁰ = 59,049 states if the elements change independently. If their changes are fully correlated there are only 3 states. The real number lies somewhere between 3 and 59,049 and it changes in time as correlation patterns themselves fluctuate.
Most methods that estimate CE in proteins treat each residue in isolation. LSP-MD sidesteps much of this problem. Its basic element is not a residue but a pair of residues. Each pair captures how two neighboring sidechains behave relative to each other, so correlations are not added on top. They are embedded from the start.
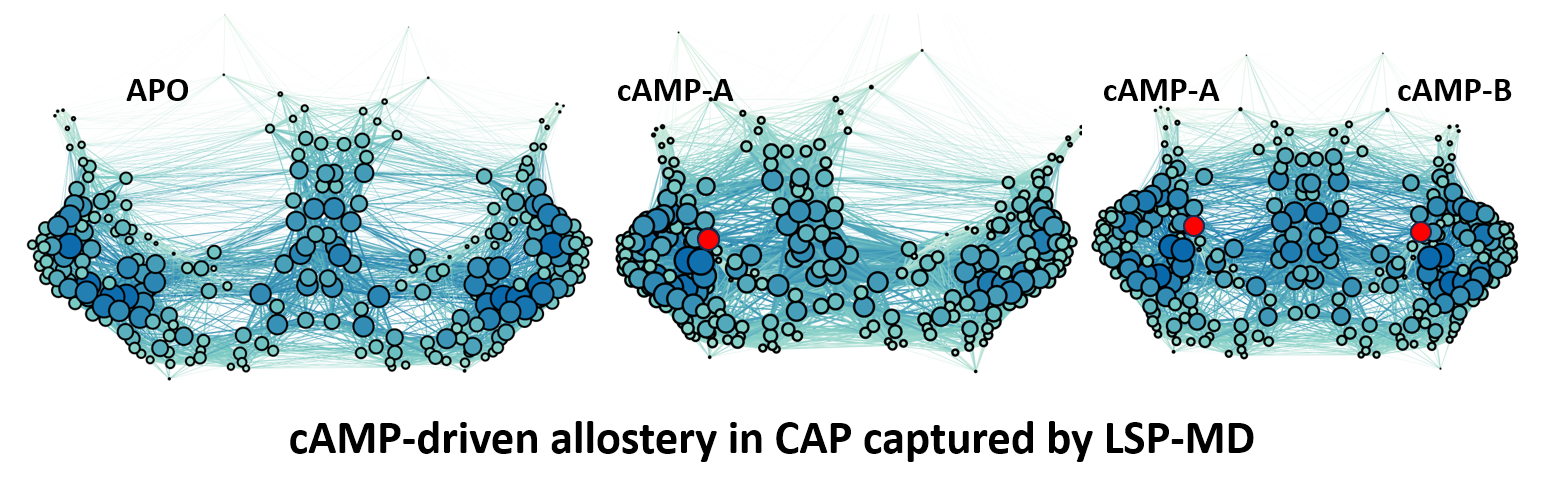
The result of a pairwise calculation is naturally a graph. Each residue is a node, and each pair gets a connection weighted by its stability value. A graph is an abstract object. Visualizing it in a way that is both meaningful and interpretable is a separate problem. ForceAtlas2, a force-directed layout algorithm, offers one useful solution. Edge weights act as springs: stable pairs attract and unstable pairs drift apart. In the figure below, thicker, darker connections indicate stronger coupling. Node size and color reflect degree centrality (the sum of a residue's stability-weighted connections), so residues embedded in many stable interactions appear large and dark, while mobile, disordered residues sit small and light at the periphery.
The layout algorithm knows nothing about the three-dimensional structure of the Catabolite activator protein (CAP). Even so, the two β-barrels that house the cAMP binding sites and the central helices that link the CAP dimer emerge as distinct structural units, organized purely by patterns of sidechain stability.
The progression from left to right tells the allosteric story. In the apo state, the network is loose and roughly symmetric. When the first cAMP binds, the central helical column shifts toward the occupied site (local entropy decreases) while the opposite binding pocket opens up, with entropy increasing on that side. This is a long-range allosteric effect, consistent with what NMR and calorimetry have measured independently. When both cAMP molecules are bound, the entire network tightens into a globally constrained, low-entropy state. Allostery you can see.
A graph is a natural way to describe a system of interacting elements, and graph theory has plenty of tools to study it: community structure, shortest paths, centrality measures, each answering a different question about the network. When a per-residue estimate of entropy is needed, degree centrality is the most direct candidate. It reflects how tightly each residue is coupled to its neighbors. But the real analytical power lies in treating the graph as a graph.
Community analysis evaluates the order within a graph by partitioning it into modules. The modules are usually treated as stable structural features. Are they?
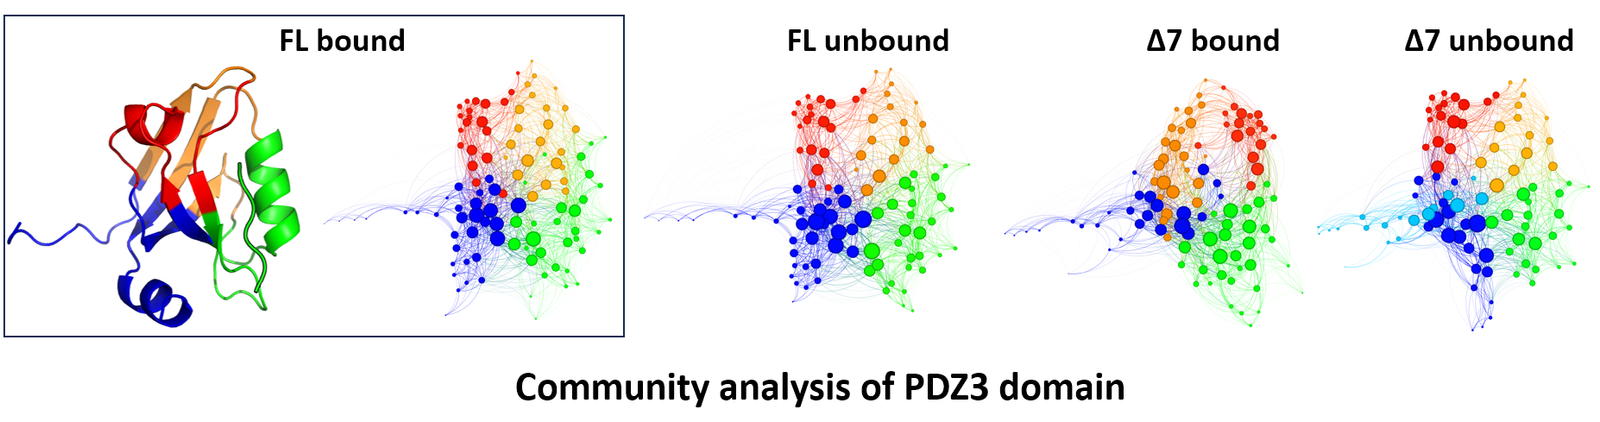
To address this question, we studied the third PDZ domain from PSD-95 (PDZ3), a small signaling module well known for entropy-driven allostery. PDZ3 binds a short peptide sequence, but binding affinity depends critically on a seven-residue C-terminal helix (α3) located far from the binding groove. Truncation of α3 reduces affinity over twenty-fold, despite producing no detectable change in the crystal structure. The four constructs are full-length (FL) and α3-truncated (Δ7), each with and without peptide. Together they form a natural 2×2 comparison: same fold, different biology, with conformational entropy as the most likely explanatory variable.
Community analysis partitions a graph into modules, groups of residues more tightly connected to each other than to the rest of the network. In a perfectly synchronized system, the entire network would form a single community. The more disordered the system, the more fragmented the community structure becomes. This makes community analysis a natural, if rough, indicator of how order distributes across the protein. The figure below shows the time-averaged community structure for all four PDZ3 constructs. The left panel maps the FL bound communities onto the three-dimensional structure for reference.
The four networks share the same general organization (four communities arranged in a similar pattern) but differ in detail. Whether these differences reflect genuine changes in network organization or artifacts of averaging is difficult to assess from a static picture. These networks collapse 500 ns of trajectory into a single snapshot. A more revealing question is whether the community structure itself is stable over that time.
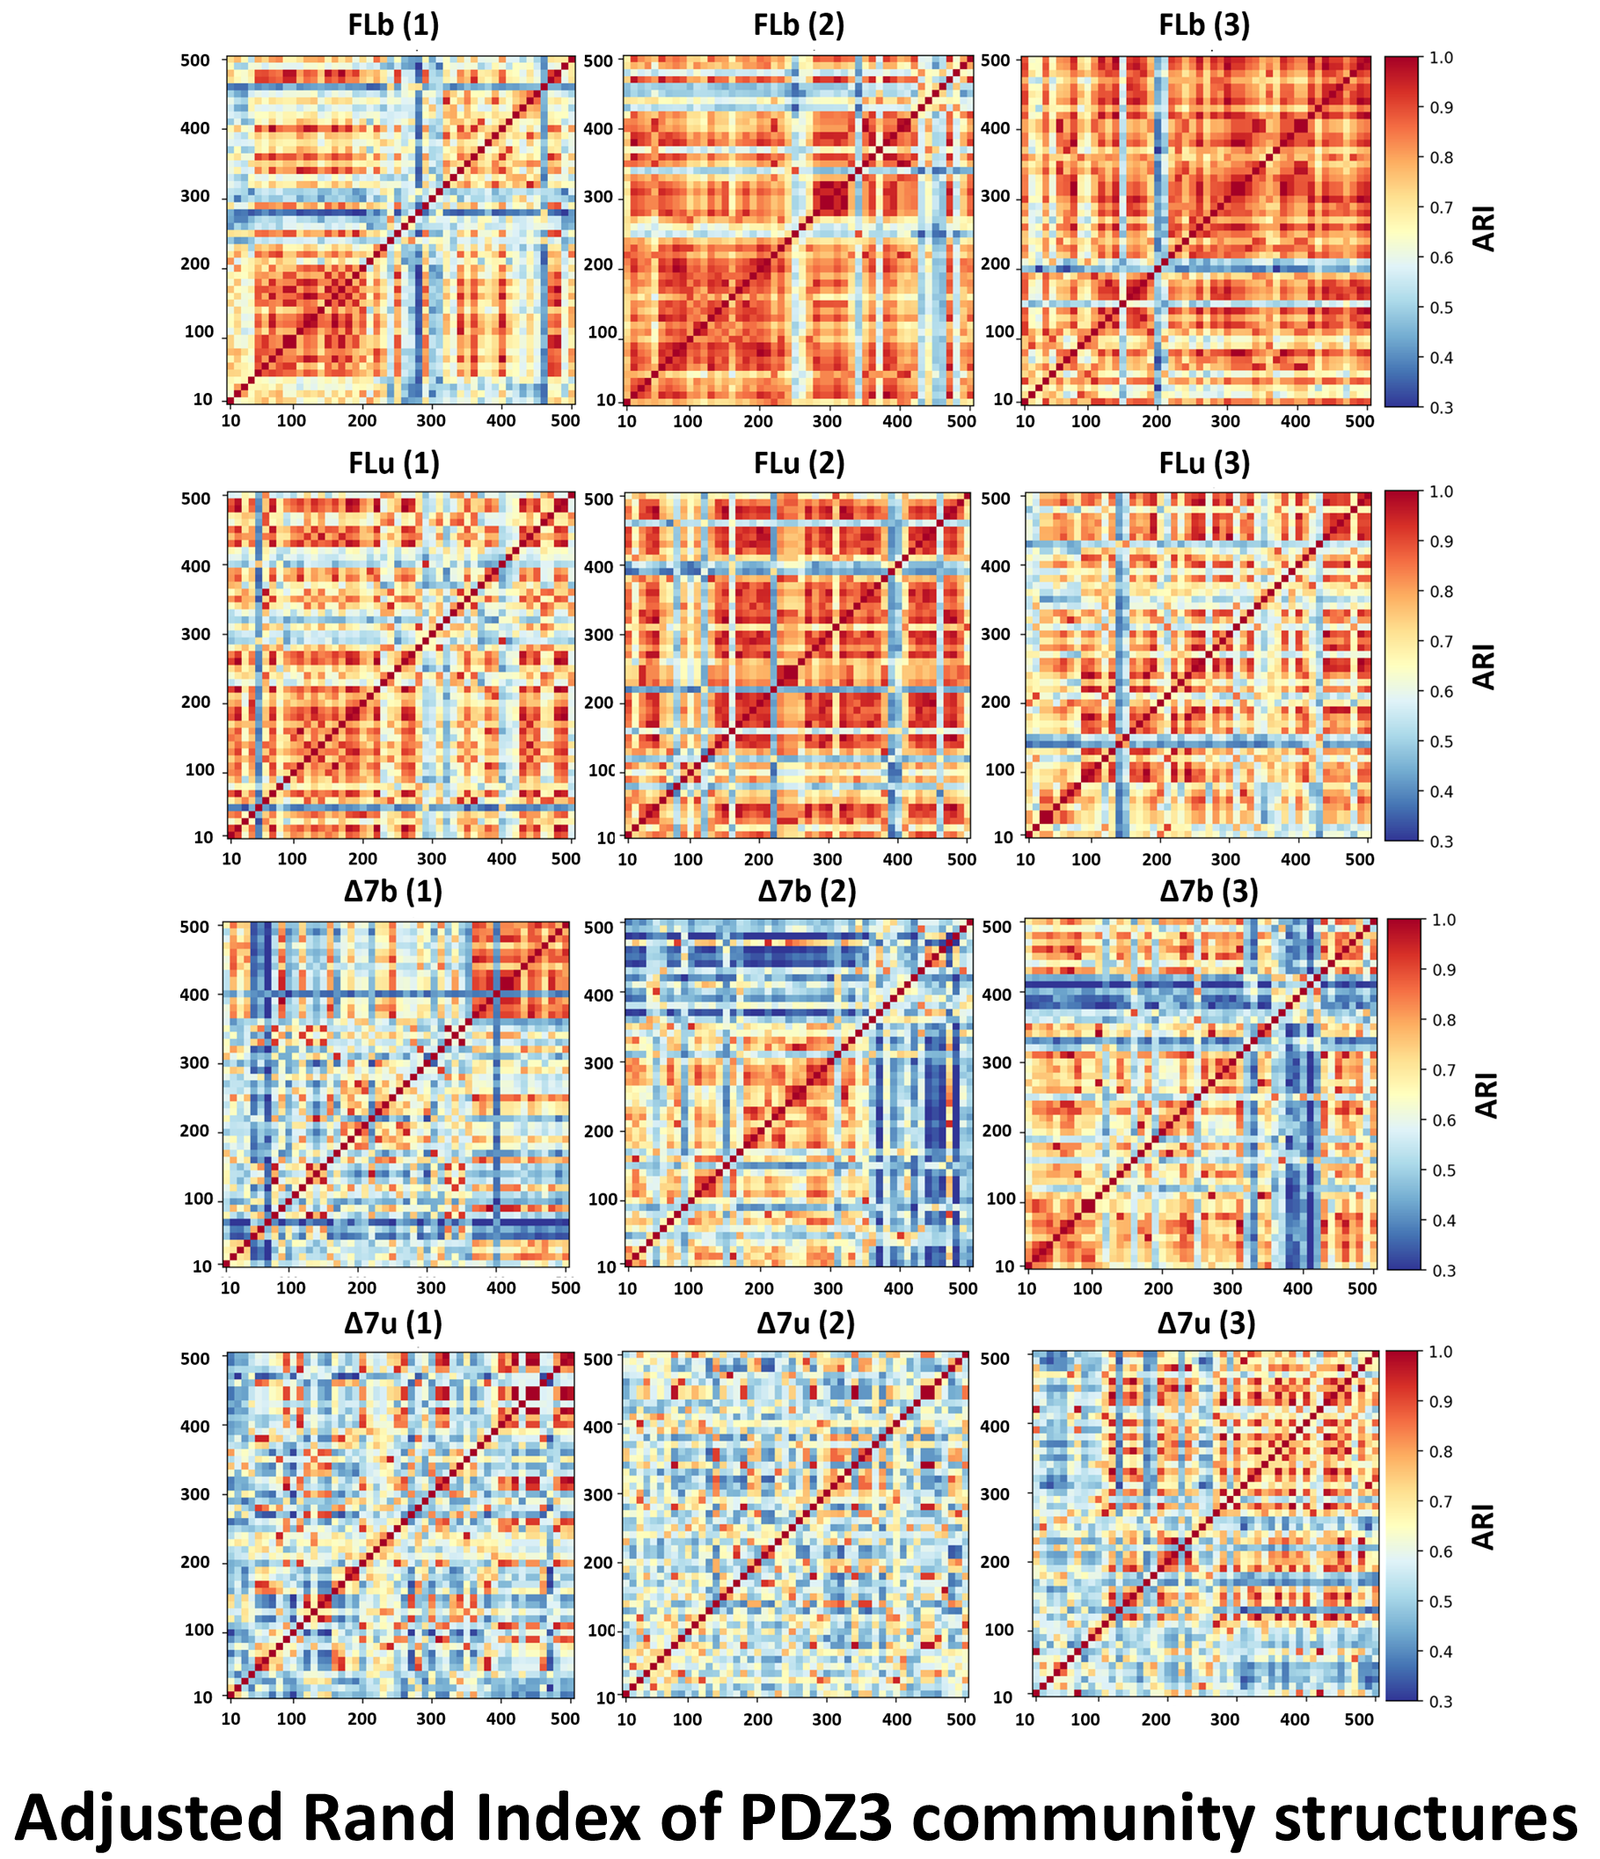
To assess community stability over time, we computed the Adjusted Rand Index (ARI) between every pair of 10 ns windows within each trajectory. ARI is a standard measure of similarity between two partitions. It equals 1.0 when community assignments are identical and decreases as they diverge. Computed for all pairs, it produces a heatmap: warm colors indicate periods of stable community structure, cold stripes indicate rapid reorganization. Each construct was simulated three times independently, the three columns per row in the figure below.
The community structure is not stable in any of the four constructs. Even in the most ordered state (FL bound), blocks of stable communities appear and disappear at different times across replicates. This is not gradual convergence toward a settled state. It is ongoing stochastic reorganization on the 50–200 ns timescale. The backbone remains stable throughout; the reorganization is entirely in the sidechain network.
From FL bound to Δ7 unbound, the pattern becomes progressively more disordered. In the truncated, unbound construct, warm blocks nearly vanish: no persistent community configuration survives on the 500 ns timescale. Four constructs with nearly identical structures produce clearly distinguishable reorganization dynamics.
What the ARI heatmaps capture is ongoing stochastic reorganization of sidechain order: not the motion of individual residues but the redistribution of their relationships across the network. We call it entropy sloshing.
This behavior has not been reported before. Community analysis in protein networks has traditionally focused on identifying communities as stable structural features. The reason sidechain communities exist in the first place is self-organization: when sidechains vibrate thermally, neighboring pairs tend to synchronize their motion, a well-known phenomenon in systems of coupled oscillators. What the ARI data show is that these synchronized clusters are not permanent. They breathe, and they breathe differently in each of the four PDZ3 constructs, despite the shared fold.
Conformational entropy is not a static property of the network. It reorganizes on slow timescales, and that reorganization distinguishes functional states that structure alone cannot tell apart. Any protein system where the biology defies structural explanation may have a similar story, one that conventional analysis is not designed to detect.
When an allosteric system carries persistent stochastic noise, separating signal from background becomes a problem. Principal component analysis is one way to do it.
The ARI heatmaps confirm that allosteric signaling is at work in PDZ3: the four constructs reorganize differently in a way consistent with the known thermodynamics. But the picture is qualitative, and the mechanistic question remains: how does the signal propagate across the domain? Quantitative analysis is complicated by the stochastic noise, which has to be filtered out before any state-specific signal can be recovered. There are well-established methods for separating reproducible signal from a stochastic background, and principal component analysis is one of them. PCA finds the directions in a multidimensional space along which the data varies the most. The first component (PC1) captures the largest share of the total variance, PC2 the largest share of what remains, orthogonal to PC1, and so on. Each data point is then described by its position along these axes.
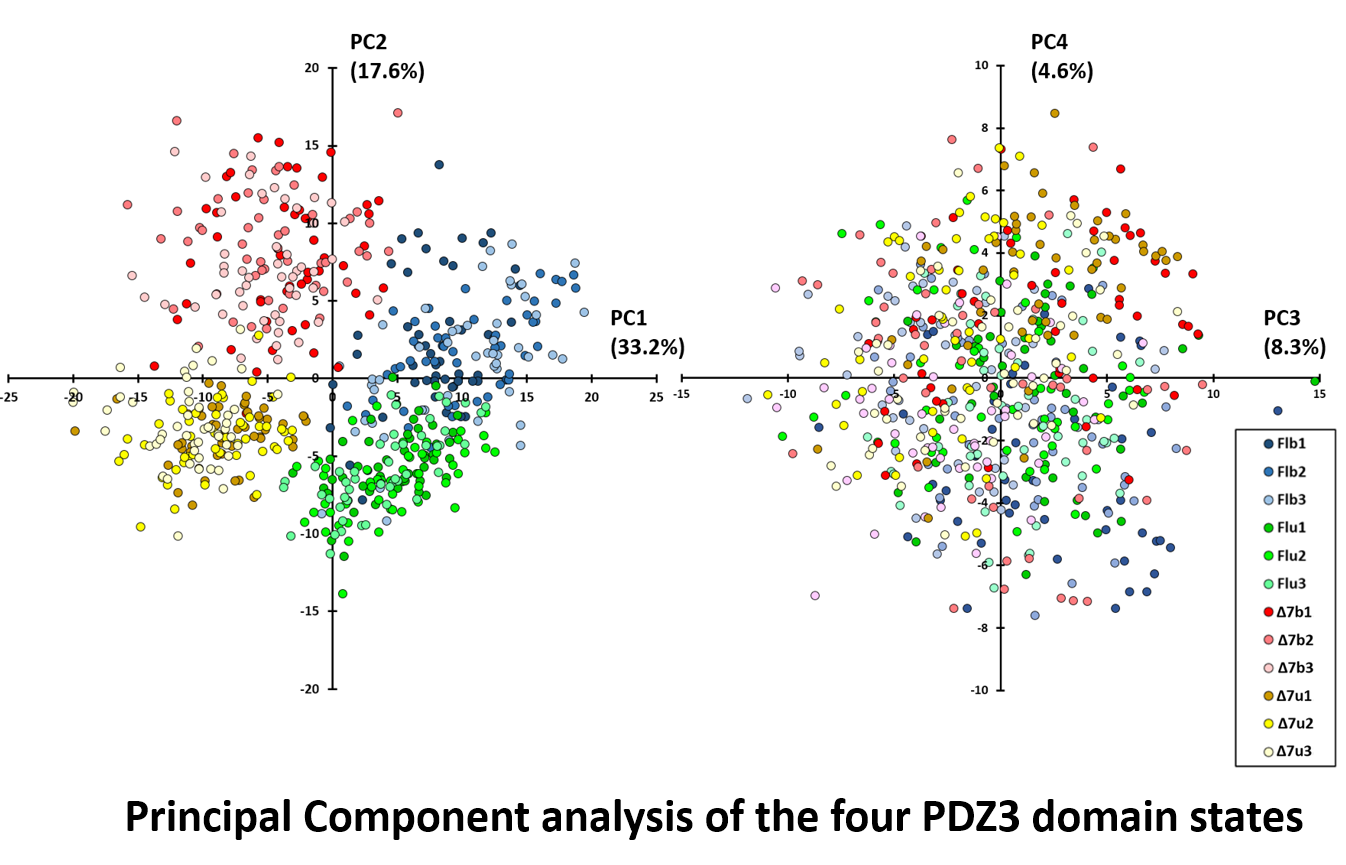
For PDZ3, degree centrality (DC) is the natural per-residue measure of the sidechain network, the same one used for CAP earlier. Each 10 ns window collapses to a 93-dimensional DC vector, and across fifty windows per trajectory, three replicates, and four constructs, the analysis takes in 600 vectors in total.
PC1 (33.2%) and PC2 (17.6%) together account for 50.8% of the variance and resolve all four constructs into distinct, non-overlapping clouds. Replicates within each construct cluster together despite sloshing. Even Δ7 unbound, the most disordered state, stays entirely within the lower-left quadrant. PC3 and PC4 carry no state information. The remaining ~49% of the variance is the sloshing itself, isolated from the signal.
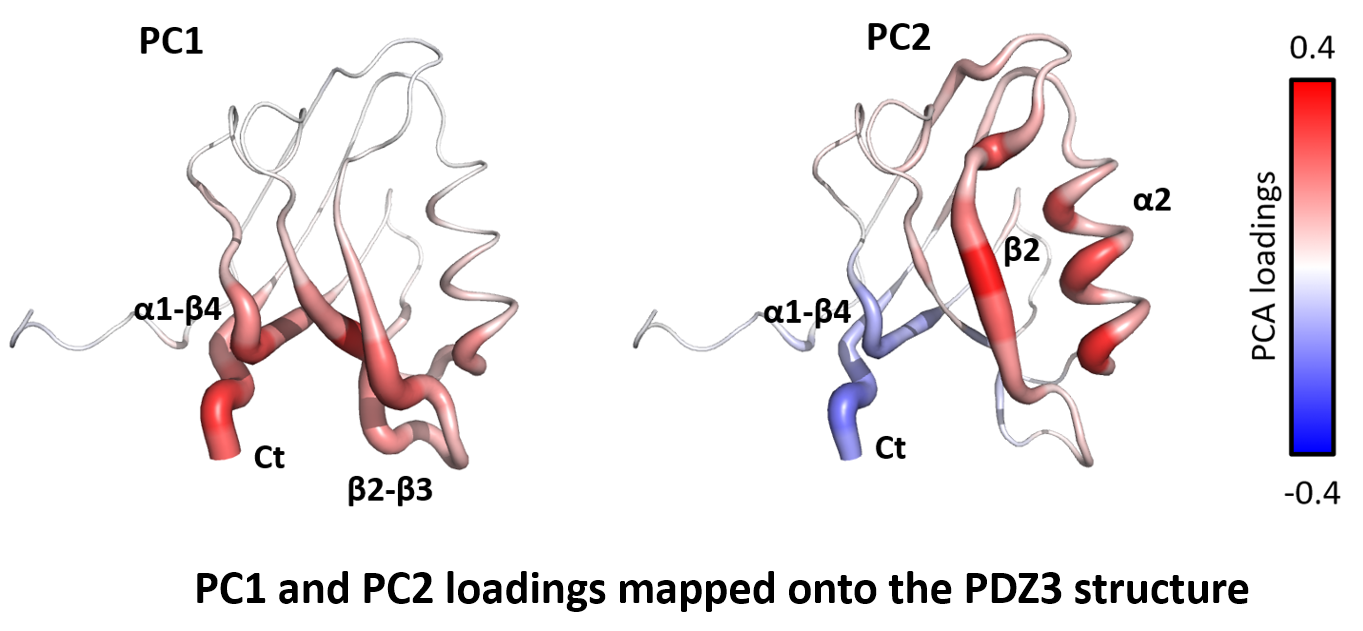
Each principal component is a weighted combination of the original residues. The weights are called loadings, and they reveal which parts of the network drive the separation. Mapped onto the structure, the loadings tell the mechanistic story.
PC1 captures local stabilization. Loadings are uniformly positive and concentrated at the C-terminus, the β2–β3 loop, and the α1–β4 linker. These are the regions in direct contact with the α3 helix in the full-length structure. The α3 helix itself does not appear on the figure: PCA operates on residues common to all four constructs, and the truncated constructs lack α3. PC1 reflects how strongly its presence stabilizes the neighboring residues, and separates full-length from truncated.
PC2 is the allosteric signal. Loadings form a seesaw: positive at the peptide binding groove (α2 and β2), negative at the α1–β4 linker and C-terminus. The pattern reflects a redistribution of sidechain order across the domain: when one side is stabilized, the other destabilizes, and vice versa. This is long-range allosteric signaling, a coordinated response between the binding groove and α3 across ~10–15 Å. Applied to the DC profiles, PCA recovers two physically distinct modes: a local stabilization effect and a long-range allosteric one, cleanly separated from each other and from the stochastic background.
I developed LSP alignment at the San Diego Supercomputer Center, originally as a method for protein surface comparison. Applying it to kinase structures led to the discovery of the regulatory and catalytic hydrophobic spines, conserved structural features now considered fundamental to kinase activation, published in PNAS in 2006 and 2008.
LSP-MD grew from that foundation, designed to make conformational entropy visible from sidechain dynamics at the timescale where allosteric signaling actually operates. LSP-alignment has been commercially licensed to Eli Lilly and Company.
PhD BiophysicsPNAS · JMB · JCTC · JPCUC San Diego / SDSC
Allosteric targets where conventional analysis runs out of resolution are the focus of this practice. Consulting and licensing inquiries are welcome.